The data

The source material.

The reports come from SUFOI, Skandinavisk UFO Information, who have collected them since the 1950s. They exist as written accounts, not as a database: free text with the date, place, time, witness count and description mixed together, written by different people over seven decades.

TOTAL

3,236 sightings

Every report in the set, from 1946 to the present.

PEAK MONTH

November

354 sightings, more than any other month.

PEAK YEAR

2008

63 sightings, the busiest year on record.

TYPICAL EVENT

5.75 minutes

Mean duration of a sighting.

Findings

Patterns in the data.

Most sightings are brief events seen by one person, late in the evening, in the second half of the year.

How it was built

Free text in, coordinates out.

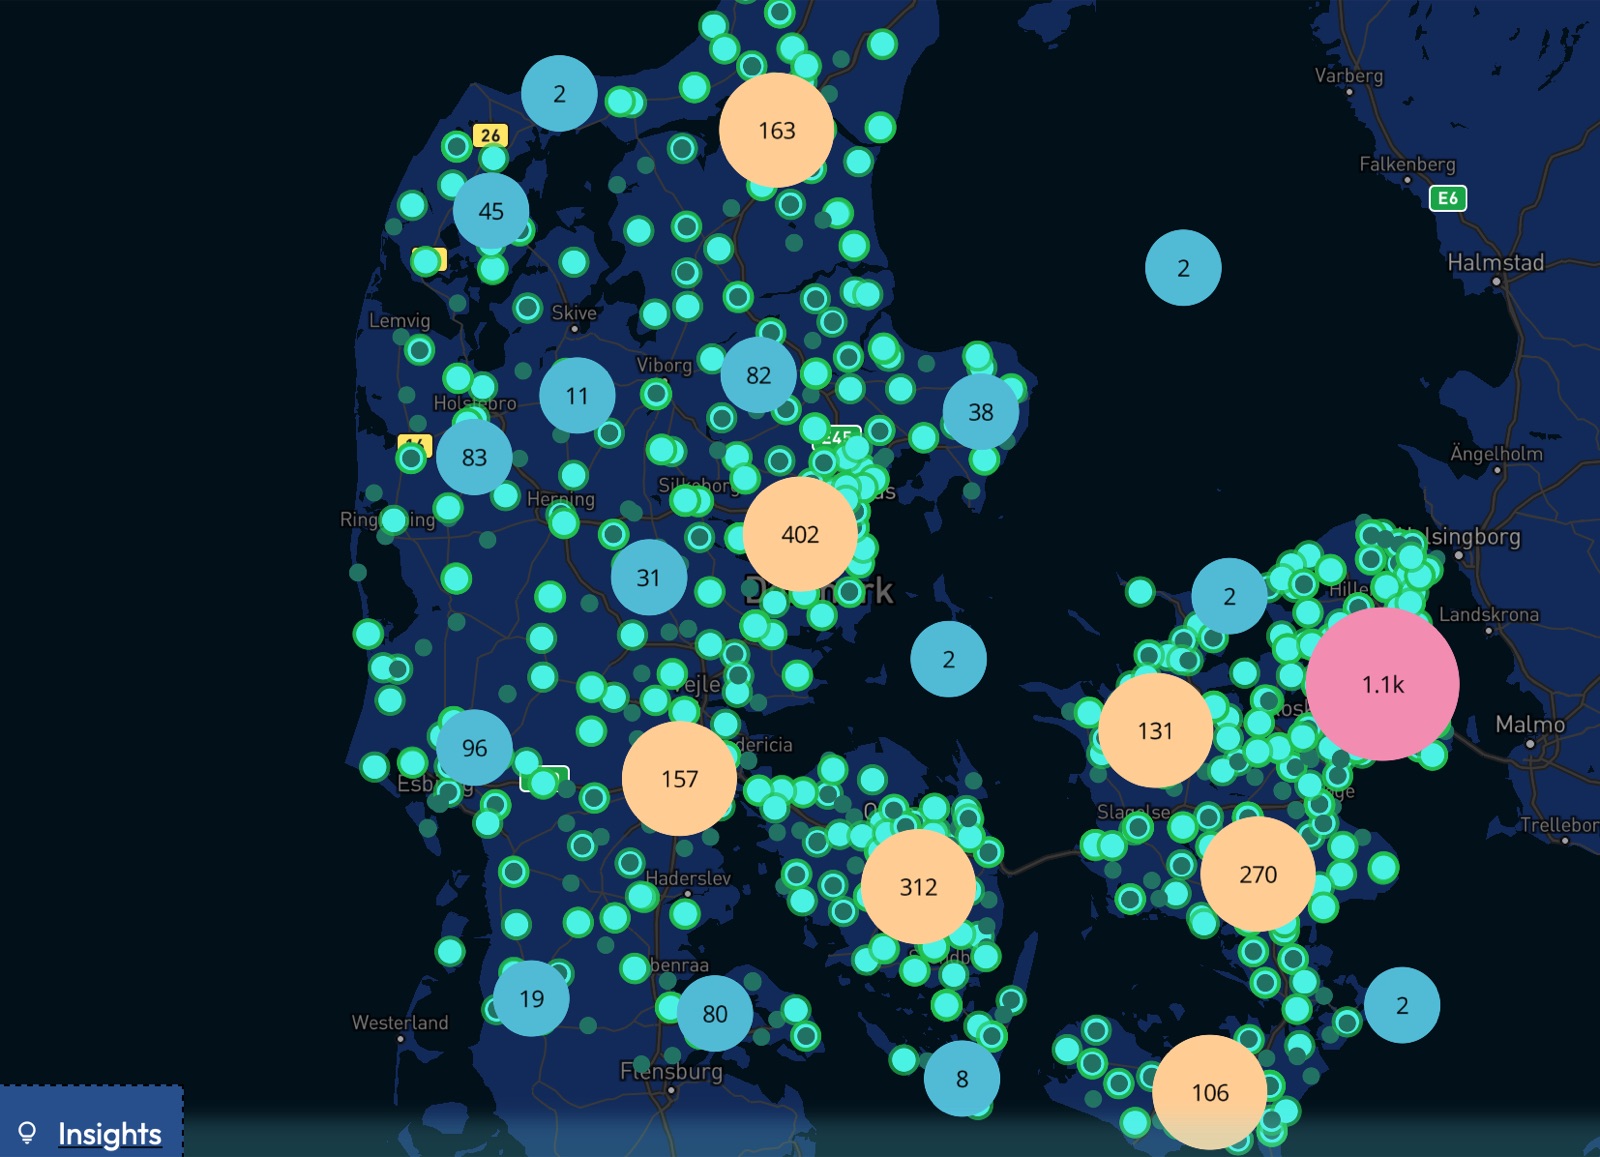
Most of the work was turning inconsistent historical records into something a map could accept. Python scripts scrape the source material, parse locations, dates and details out of text written in very different styles over seventy years, and resolve each place name to a coordinate.

GPT-4 wrote and iterated much of the cleaning logic: date parsing across a dozen formats, location extraction, and handling of records that fit no pattern. The output is one GeoJSON file that the front end loads and clusters.

01

Scrape

Python pulls the reports from the source archive, one page at a time.

02

Extract

Dates, places, witness counts, durations and colours parsed out of free prose.

03

Geocode

Place names and postcodes resolved to latitude and longitude for Denmark.

04

Map

One GeoJSON file, clustered and filtered client side with Mapbox GL.
In the map

Features.

Built with

Python GPT-4 GeoJSON Mapbox GL JS Vanilla JS Netlify

Credit

Source data.

SUFOI

All sighting data comes from SUFOI, Skandinavisk UFO Information, who collected and published it. This project structures and maps their archive. It makes no claim about what people saw.

The map code is open source under the MIT licence.